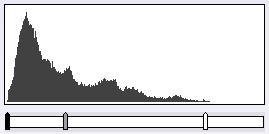
Before you start to work with levels, you need to understand histograms. A histogram is like a bar graph. It indicates the number of pixels in a photo that are at each level between completely black (0) to completely white (255). For example, in the histogram below there are no completely black pixels, but there are a lot of dark pixels and some completely white pixels:
Every photo has a different histogram. There is no perfect or normal histogram. For example, a histogram that shows a concentration of pixels in the darker levels would be normal for a photo of a sunset. A histogram that shows a concentration of pixels in the lighter levels would be normal for a photo of a group wearing white.
The Levels tool gives you control over the blackpoint and whitepoint in the photo. The blackpoint is the point at which pixels are completely black, while the whitepoint is the point at which pixels are completely white. If there are no completely black pixels in a photo, you can set the darkest pixels in the photo as the new blackpoint. Similarly, if there are no completely white pixels in a photo you can set the lightest pixels in the photo as the new whitepoint.
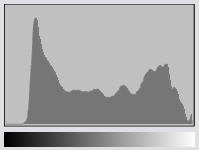
There are two sets of sliders that allow you to identify the new blackpoint and whitepoint. Use the Input Levels slider if you want to increase the tonal range and contrast in the photo. Use the Output Levels slider if you want to decrease the tonal range and contrast in the photo.
To Adjust Levels: