Debugging ACDSee Plug-Ins in Visual Studio
It is fairly straightforward to get your created plug-in into a debugging environment using Visual Studio. This guide requires that you have already set up moving your built plug-in to ACDSee Photo Studio's "PlugIns" folder.
Click images to view in full size.
Opening Your Plug-In in a Debugger:
- Open a plug-in solution in Visual Studio.
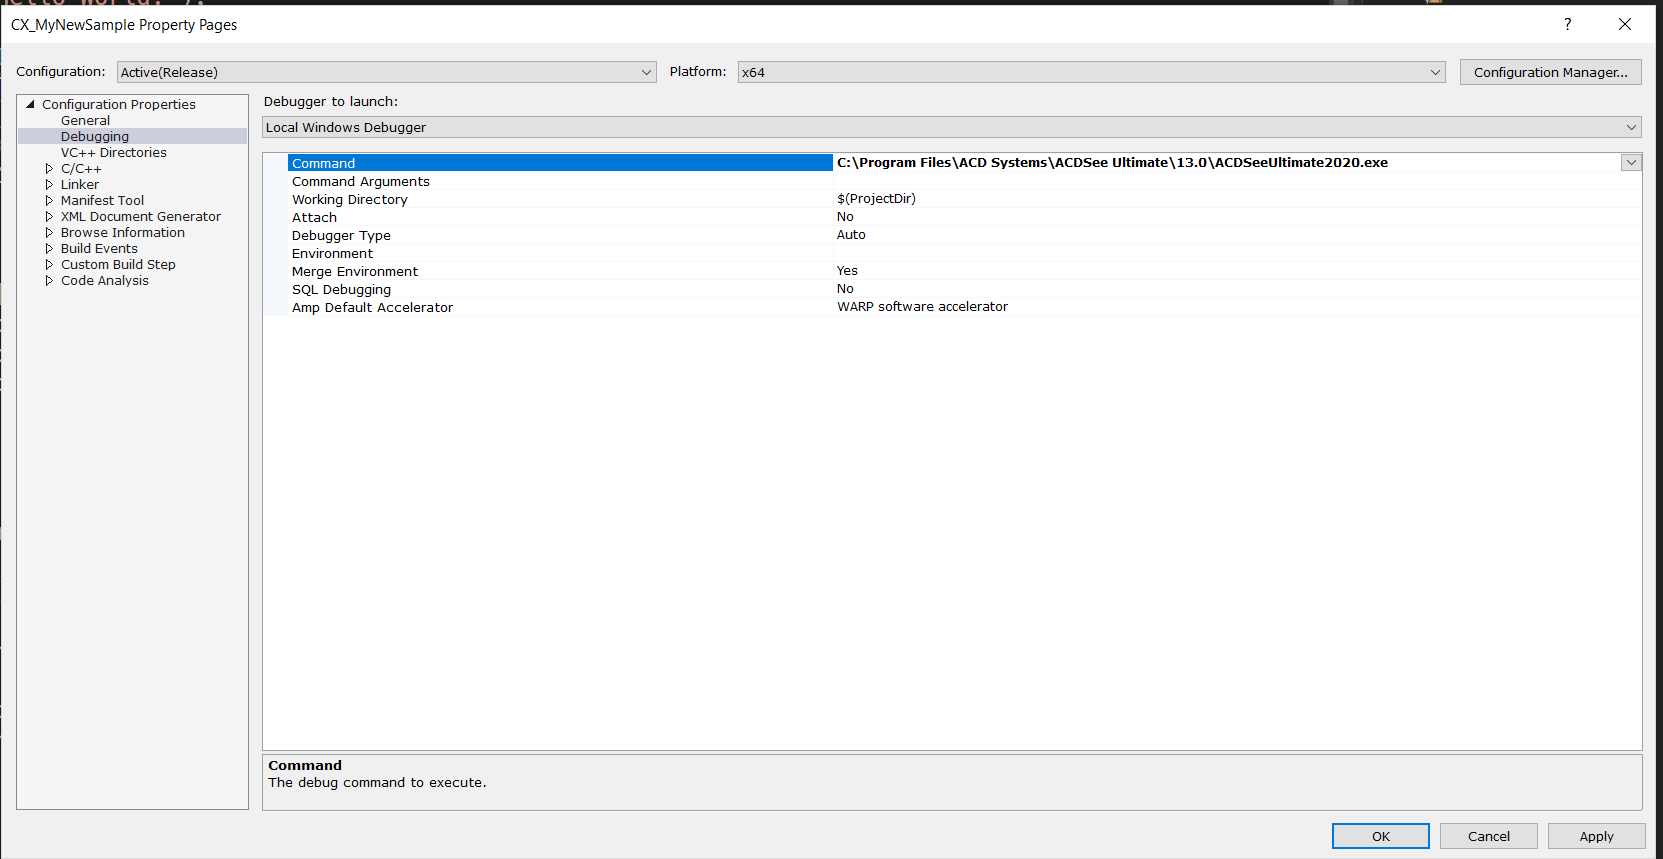
- Open the property sheets of the main project.
- In the Command field of the Configuration Properties | Debugging tab, enter the path to your ACDSee Photo Studio installation, such as "C:\Program Files\ACD Systems\ACDSee Ultimate\13.0\ACDSeeUltimate2020.exe"
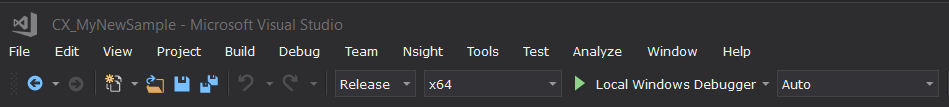
- Now, when you start debugging in Visual Studio, it will launch ACDSee Photo Studio with a debugger attached, and you can set breakpoints in and step through your plug-in code.